
PocketSEOPocketSEO

Best Core Web Vitals Tips (2026)

8 tips · ~11 min read · 2,691 words · Updated 2026

Core Web Vitals directly impact your rankings. Google uses LCP, INP, and CLS as measurable signals of user experience, and sites that fail these metrics face a real ranking disadvantage. These tips focus on the performance optimizations that actually move the needle — from image delivery and font loading to JavaScript execution and layout stability fixes that practitioners have validated with real field data.

Beginner Quick Win

What is Cumulative Layout Shift?

Cumulative Layout Shift (CLS) measures how much your content moves around while the page loads. Every time an element jumps because an image, ad, or font loads late, it adds to the score. Those jumps are why you sometimes tap the wrong button on a half-loaded page.

CLS is the Core Web Vital that tracks visual stability, and it is one of the easiest to fix once you know the causes.

What is a good CLS score?

A good CLS is 0.1 or less. According to Google, scores at or below 0.1 pass, scores above 0.25 are poor, and the value is measured at the 75th percentile of real visits. CLS is a unitless score, not a measure of time.

Lower is better, and a score of zero is realistic on a carefully built page.

How do you stop images and embeds from shifting?

Reserve the space before the content loads. When the browser knows an element's size in advance, it holds the spot and nothing below it jumps.

  • Set width and height on every image. Modern browsers use these attributes to calculate an aspect ratio and reserve space before the file arrives.
  • Give ads and iframes a fixed container. Wrap ad slots in a box with a defined min-height so late-loading creatives fill reserved space instead of shoving text down.
  • Reserve space for embeds. YouTube frames, maps, and social widgets all need a sized container with a known aspect ratio.

How do fonts cause layout shift?

Web fonts trigger shifts when the fallback font swaps for your custom font at a slightly different size. Every line of text nudges as the swap happens, which quietly inflates your CLS.

Control it with the font-display property and font metrics:

  • Preload your critical fonts so they arrive sooner.
  • Use font-display: optional or swap to control how the browser handles the swap.
  • Match the fallback font's metrics to the web font with size-adjust, so the swap barely moves anything.

Fix the biggest offenders first. Open the Performance panel in Chrome DevTools, find the Layout Shift regions and the elements that move most, and reserve their space. Re-test in PageSpeed Insights and watch field CLS drop over the following month.

Want the full playbook? Read our guide on Technical SEO Audits: Which Fixes to Prioritize First.

Key Takeaway

Reserve space for images, ads, embeds, and fonts before they load, and CLS stays at or below the 0.1 good threshold.

Source: @pocketseo on Web

Full tip page
Intermediate Quick Win

What does Largest Contentful Paint measure?

Largest Contentful Paint (LCP) measures how long it takes for the biggest element in the viewport to render. On most pages that element is the hero image, a large banner, or a headline block. LCP marks the moment your main content actually appears to the visitor.

It is one of the three Core Web Vitals and the clearest proxy for the question every user asks: does this page feel fast?

What is a good LCP score?

A good LCP is 2.5 seconds or less. According to Google, pages should hit 2.5 s at the 75th percentile of visits, while anything over 4 seconds is rated poor. The clock starts the moment the user requests the page.

Most LCP failures share one cause: the hero image loads too late because the browser discovers it too slowly.

How does preloading the hero image cut LCP?

Preloading tells the browser to fetch your hero image right away, before it finds the image in CSS or further down the HTML. By default, browsers discover background images and below-the-fold assets late, which pushes the paint back.

Add a preload hint in the <head>:

<link rel="preload" as="image" href="/hero.webp" fetchpriority="high">

The fetchpriority="high" attribute does the heavy lifting. It tells the browser this image outranks other downloads, so it jumps to the front of the queue instead of waiting behind scripts and fonts.

What else speeds up LCP?

Preloading helps most when you pair it with these steps:

  • Never lazy-load the LCP image. Remove loading="lazy" from the hero. Lazy loading delays the one image you want to arrive first.
  • Serve modern formats. Use WebP or AVIF and compress hard. Smaller files paint sooner.
  • Set explicit dimensions. Add width and height so the browser reserves space and skips a re-layout.
  • Use a CDN. A shorter network hop means the image lands faster.

Add fetchpriority="high" directly on the <img> tag too, so the priority hint still applies if the preload is missed. Test before and after in PageSpeed Insights, then confirm the win in field data over the next few weeks.

Want the full playbook? Read our guide on Technical SEO Audits: Which Fixes to Prioritize First.

Key Takeaway

Your hero image is usually the LCP element, so preload it and set fetchpriority high to make your main content paint well under 2.5 seconds.

Source: @pocketseo on Web

Full tip page
Intermediate Medium Effort

What is Interaction to Next Paint?

Interaction to Next Paint (INP) measures how quickly your page responds to user input across the whole visit. It records the delay between a tap, click, or keypress and the next visual update on screen. On March 12, 2024, INP replaced First Input Delay (FID) as one of the three Core Web Vitals.

FID only measured the delay of the very first interaction. INP is stricter: it watches every interaction and reports the slowest one, so it reflects how the page actually feels to use.

What counts as a good INP score?

A good INP is 200 milliseconds or less. According to Google, an INP at or below 200 ms means the page responds quickly, an INP above 500 ms is rated poor, and the value is measured at the 75th percentile of real visits.

Target the good band on mobile first. Mobile processors are slower, interactions cost more there, and most sites see their weakest scores on phones.

How do you fix a slow INP?

Slow INP almost always traces back to JavaScript blocking the main thread. These three fixes move the needle most:

  • Break up long tasks. Any script that runs over 50 ms blocks input. Split heavy work into smaller chunks and hand control back to the browser with setTimeout or scheduler.yield().
  • Defer non-critical JavaScript. Load analytics, chat widgets, and third-party tags with defer, or only after the first user interaction. They rarely need to run before the page is interactive.
  • Reduce main-thread work. Remove unused code, avoid huge re-renders, and keep event handlers light. The less the main thread does, the faster it can paint the next frame.

Fix the heaviest interaction first, since INP reports your worst one.

How do you measure INP in the field?

Use field data, not lab tools alone. Lab tests cannot reproduce the messy real interactions that drive INP. Pull real-user numbers from the Chrome User Experience Report (CrUX), the Core Web Vitals report in Google Search Console, or PageSpeed Insights.

For live debugging, the web-vitals JavaScript library reports INP along with the exact element that caused the slow interaction. Fix that element, ship it, then confirm the gain in CrUX over the following 28 days.

Want the full playbook? Read our guide on JavaScript Mobile SEO: Fix Rendering Before It Kills Rankings.

Key Takeaway

INP tracks how fast your page responds to every interaction; keep it under 200ms by breaking up long JavaScript tasks and deferring non-critical scripts.

Source: @pocketseo on Web

Full tip page
Beginner Quick Win

What is the fastest way to fix PageSpeed Insights warnings?

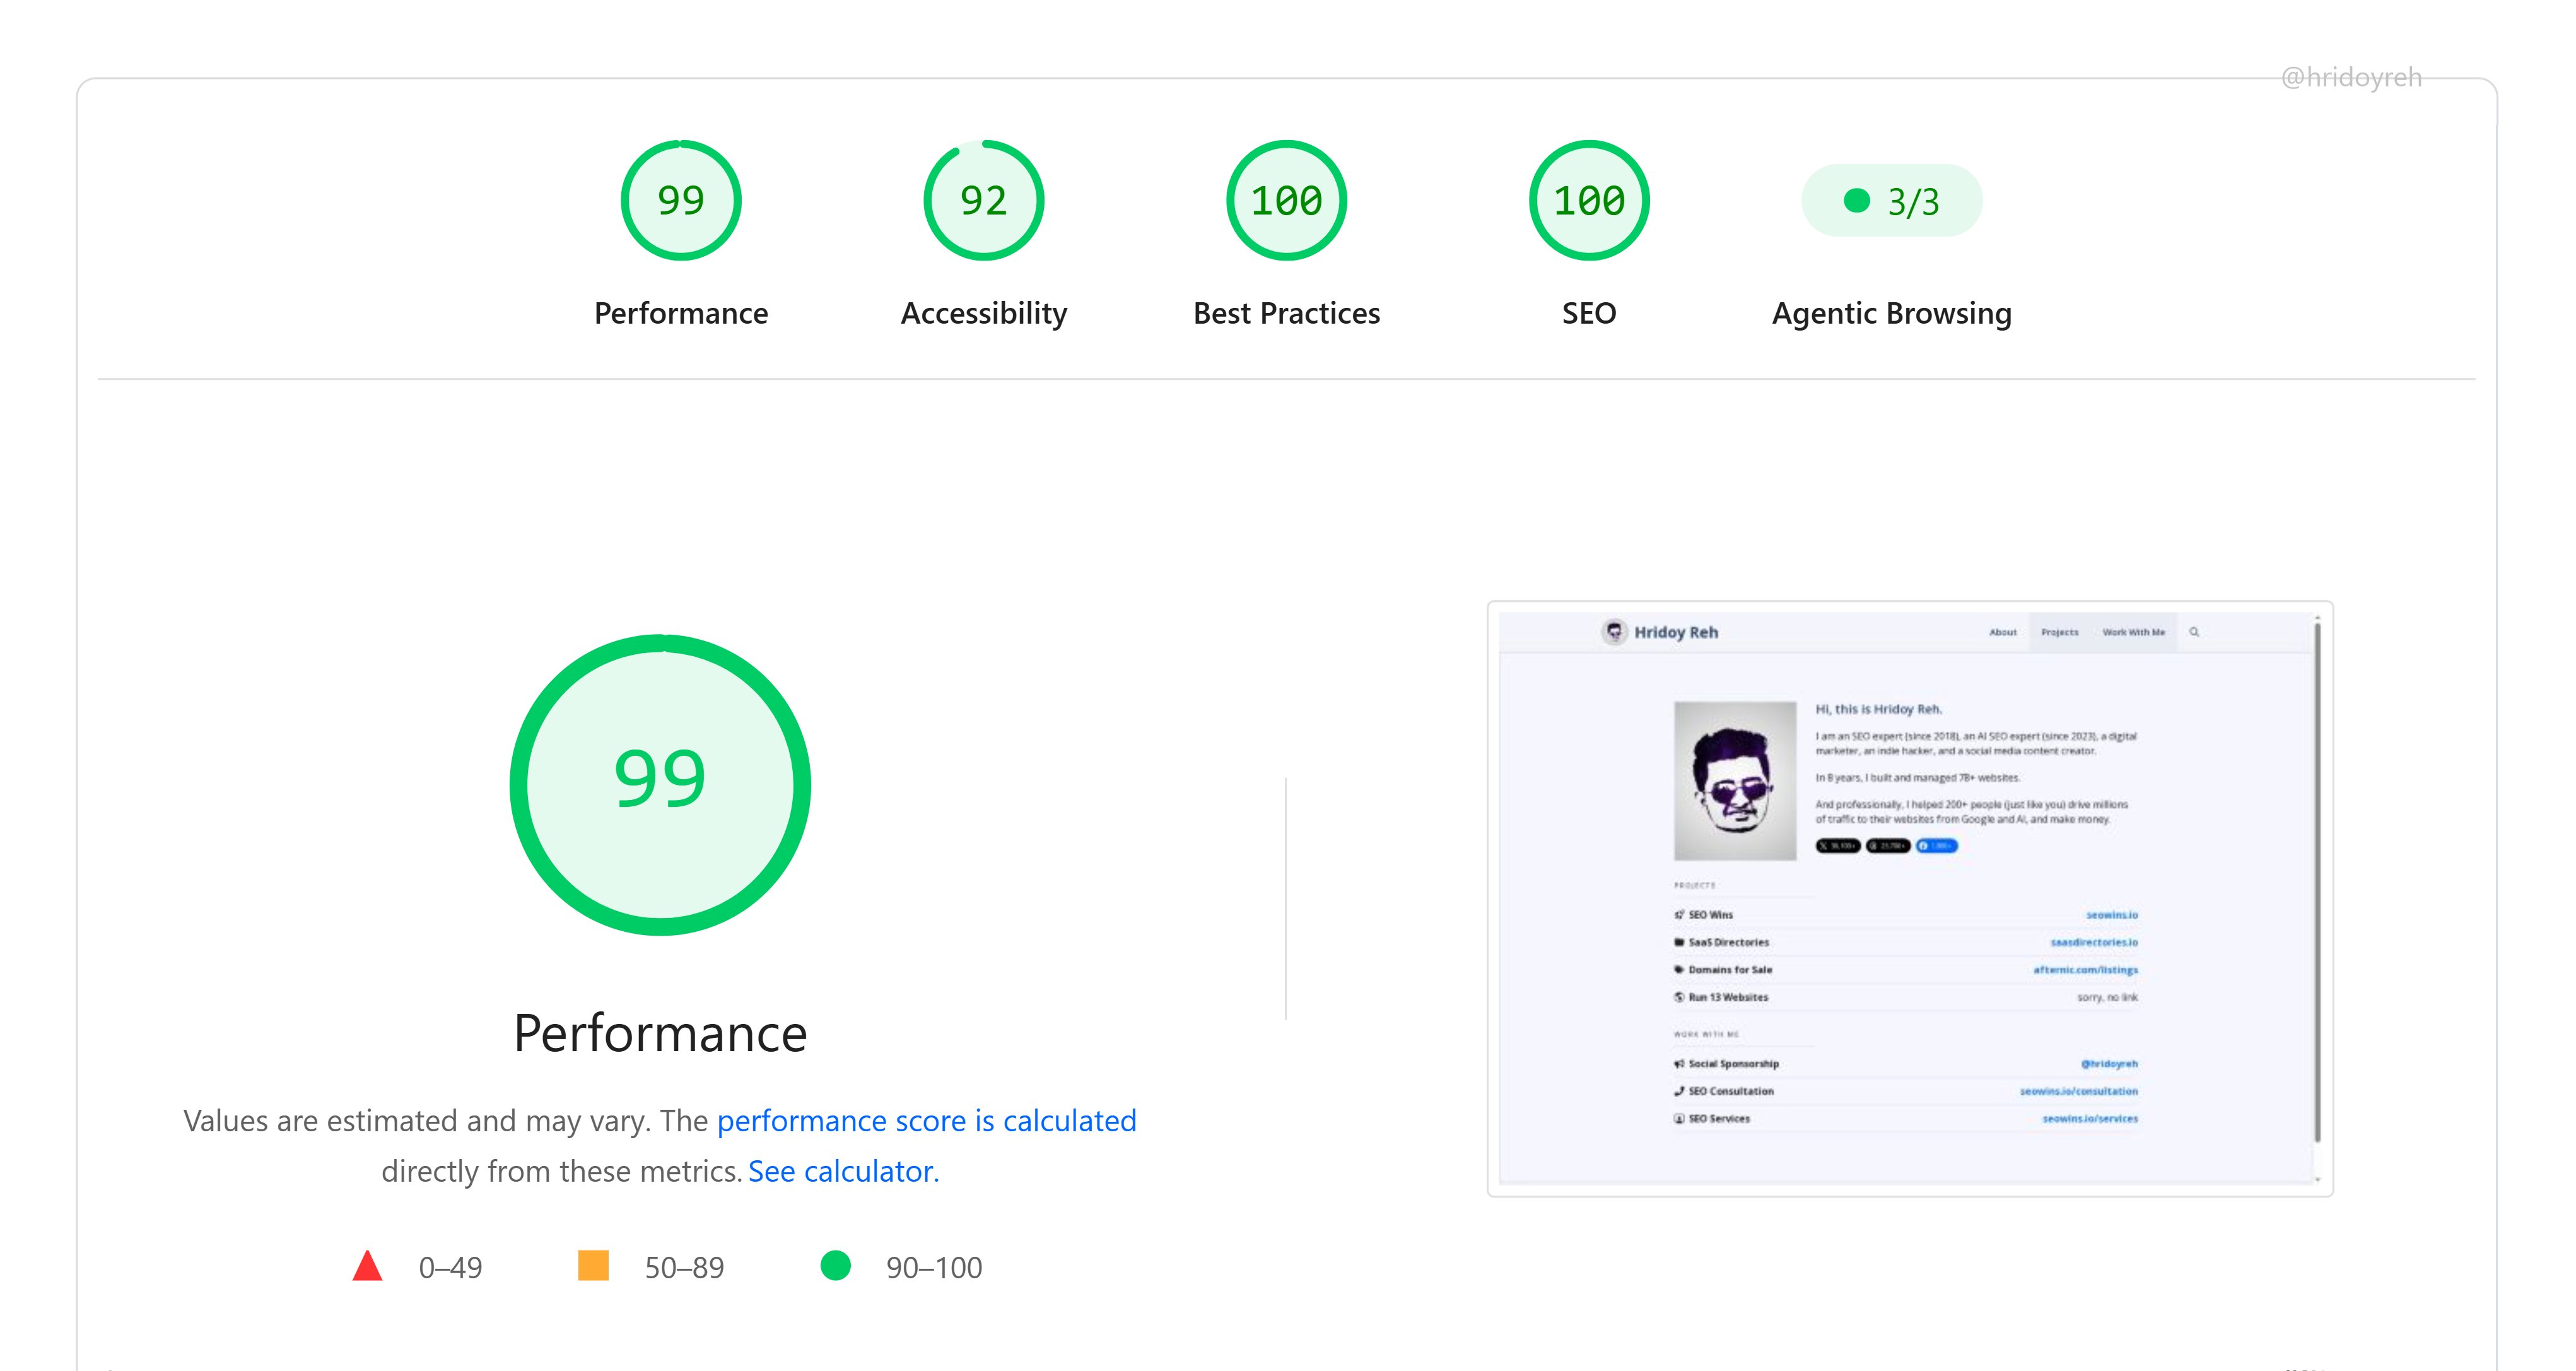
PageSpeed Insights hands you a prioritized list of exactly what's slowing your site down. Most people read it, feel overwhelmed, and close the tab. A quicker approach: copy those issues straight into an AI coding tool and let it write the fixes.

Here's the workflow:

  1. Go to PageSpeed Insights and run your URL
  2. Scroll to the "Opportunities" and "Diagnostics" sections
  3. Copy the problem descriptions — all of them
  4. Open an AI coding tool (Cursor, GitHub Copilot, ChatGPT with code, or similar)
  5. Paste the issues and ask it to generate the fixes for your specific stack
  6. Review the output, test locally, then deploy

What used to take a developer half a day now takes under an hour, including review time.

Which PageSpeed issues does this work best for?

Use AI to fix PageSpeed Insights issues in minutes

AI coding tools handle the mechanical fixes well:

  • Render-blocking resources — moving scripts to defer or async
  • Unused JavaScript and CSS — identifying dead code to remove or lazy-load
  • Image sizing and format — converting to WebP, adding width/height attributes
  • Missing cache headers — writing the correct server config or .htaccess rules
  • Largest Contentful Paint (LCP) element — preloading hero images or fonts

They're less reliable for architectural issues like third-party scripts you don't control or CMS plugin conflicts. Those still need a human eye.

Why does page speed matter for SEO?

Google confirmed Core Web Vitals as a ranking signal in 2021, and speed is central to that. According to Google's own research, pages that load within two seconds see significantly lower bounce rates than those taking five or more seconds. Faster pages also tend to earn more crawl budget, which matters if you have a large site.

A PageSpeed score isn't the direct ranking factor — the underlying field data (real user measurements in Chrome) is what Google uses. But improving your score almost always moves the field data in the right direction.

Should you fix issues manually instead?

If you're comfortable in code, manual fixes give you more control and you'll understand exactly what changed. That matters for debugging later.

But if you're a solo founder or a small team without a dedicated developer, the AI-assisted approach gets you to a working fix faster. Treat the AI output as a first draft: read it, understand what it's doing, test it in a staging environment, then ship.

Don't paste AI-generated code directly into production without testing. That's the one step worth slowing down for.

Want the full playbook? Read our guide on 30 ChatGPT Prompts for SEO: Copy-Paste Templates for 2026.

Key Takeaway

Run your site through PageSpeed Insights, copy the list of issues it flags, and paste them into an AI coding tool to generate fixes. This approach works well for render-blocking scripts, image optimization, unused CSS, and cache headers. What used to require hours of developer work can be resolved in under an hour. Always test AI-generated code in a staging environment before deploying. Page speed affects Core Web Vitals, which Google uses as a ranking signal.

Source: @hridoyreh on Twitter/X

Full tip page
Beginner Quick Win

Why Unused Apps Kill Your Store Speed

Every Shopify app you install adds code to your store's theme, even when you're not actively using it.

This leftover code continues to load on every page visit, creating unnecessary bloat that slows down your site.

Many store owners install apps to test features, then forget to remove them after deciding not to use them. Meanwhile, these dormant apps are quietly sabotaging your Core Web Vitals scores and customer experience.

Quick App Audit Process

Here's how to clean up your app collection:

  1. Review your installed apps — Go to Settings > Apps and sales channels in your Shopify admin
  2. Identify unused apps — Look for apps you haven't touched in 30+ days
  3. Check for redundant functionality — Multiple apps doing similar things create code conflicts
  4. Test before removing — Disable the app first to ensure no critical features break
  5. Uninstall completely — Don't just disable; fully remove to eliminate leftover code

What to Look For

Prioritize removing these app types that typically add the most bloat:

  • Chat widgets you're not monitoring
  • Email popup builders with better alternatives
  • Review apps replaced by native Shopify features
  • Social media widgets that rarely get engagement
  • A/B testing tools from completed experiments

Measure Your Impact

After removing unused apps:

  • Run a fresh PageSpeed Insights test
  • Check your Core Web Vitals in Search Console
  • Monitor your bounce rate for improvements
  • Test checkout flow to ensure nothing broke

Most stores see 10-20% speed improvements just from app cleanup. Your customers will notice faster loading times, and Google's algorithm will reward you with better rankings for the improved user experience.

Want the full playbook? Read our guide on Ecommerce SEO Quick Wins: Rank Higher in Days.

Key Takeaway

Fully uninstall dormant Shopify apps, not just disable them, to strip leftover theme code that silently bloats every page and drags down Core Web Vitals.

Source: @growwithcro on Twitter/X

Full tip page
Beginner Quick Win

Most site owners check page speed once, then never think about it again

That's a mistake. Your site's loading time shifts constantly — every new image upload, plugin install, or third-party embed changes it.

Why page speed matters more than you think

Google uses Core Web Vitals as a ranking factor. Slow sites get pushed down in search results. But beyond SEO:

  • Bounce rates spike when pages take longer than 3 seconds to load
  • Conversion rates drop 7% for every additional second of load time
  • Mobile users abandon sites faster than desktop users

The 3 changes that improve speed fastest

1. Optimize images before uploading

Images cause 50% of slow loading times. Don't upload 2MB photos straight from your camera.

  • Compress images to under 100KB using TinyPNG or Squoosh
  • Use WebP format instead of JPEG when possible
  • Add proper width and height attributes to prevent layout shifts

2. Audit your plugins monthly

That "helpful" plugin you installed last month might be loading 15 scripts on every page.

  • Deactivate plugins you don't actively use
  • Use tools like Query Monitor to see which plugins slow down your site
  • Replace heavy plugins with lightweight alternatives when possible

3. Clean up third-party embeds

Every YouTube video, social media widget, or chat tool adds external requests.

  • Load videos with thumbnail placeholders instead of auto-embedding
  • Use lazy loading for non-essential widgets
  • Remove analytics scripts you don't actually check

Monitor speed as an ongoing task

Set up monthly Google PageSpeed Insights checks. Your speed score today won't be your score next month.

Treat page speed like you treat content — something that needs regular attention, not a one-time setup.

Want the full playbook? Read our guide on Technical SEO Audits: Which Fixes to Prioritize First.

Key Takeaway

Page speed drifts with every image, plugin, and embed you add, so compress images, audit plugins monthly, and lazy-load third-party widgets to keep it fast.

Source: @pentaclay on Twitter/X

Full tip page
Beginner Quick Win

Don't Panic When Your Core Web Vitals Don't Improve Immediately

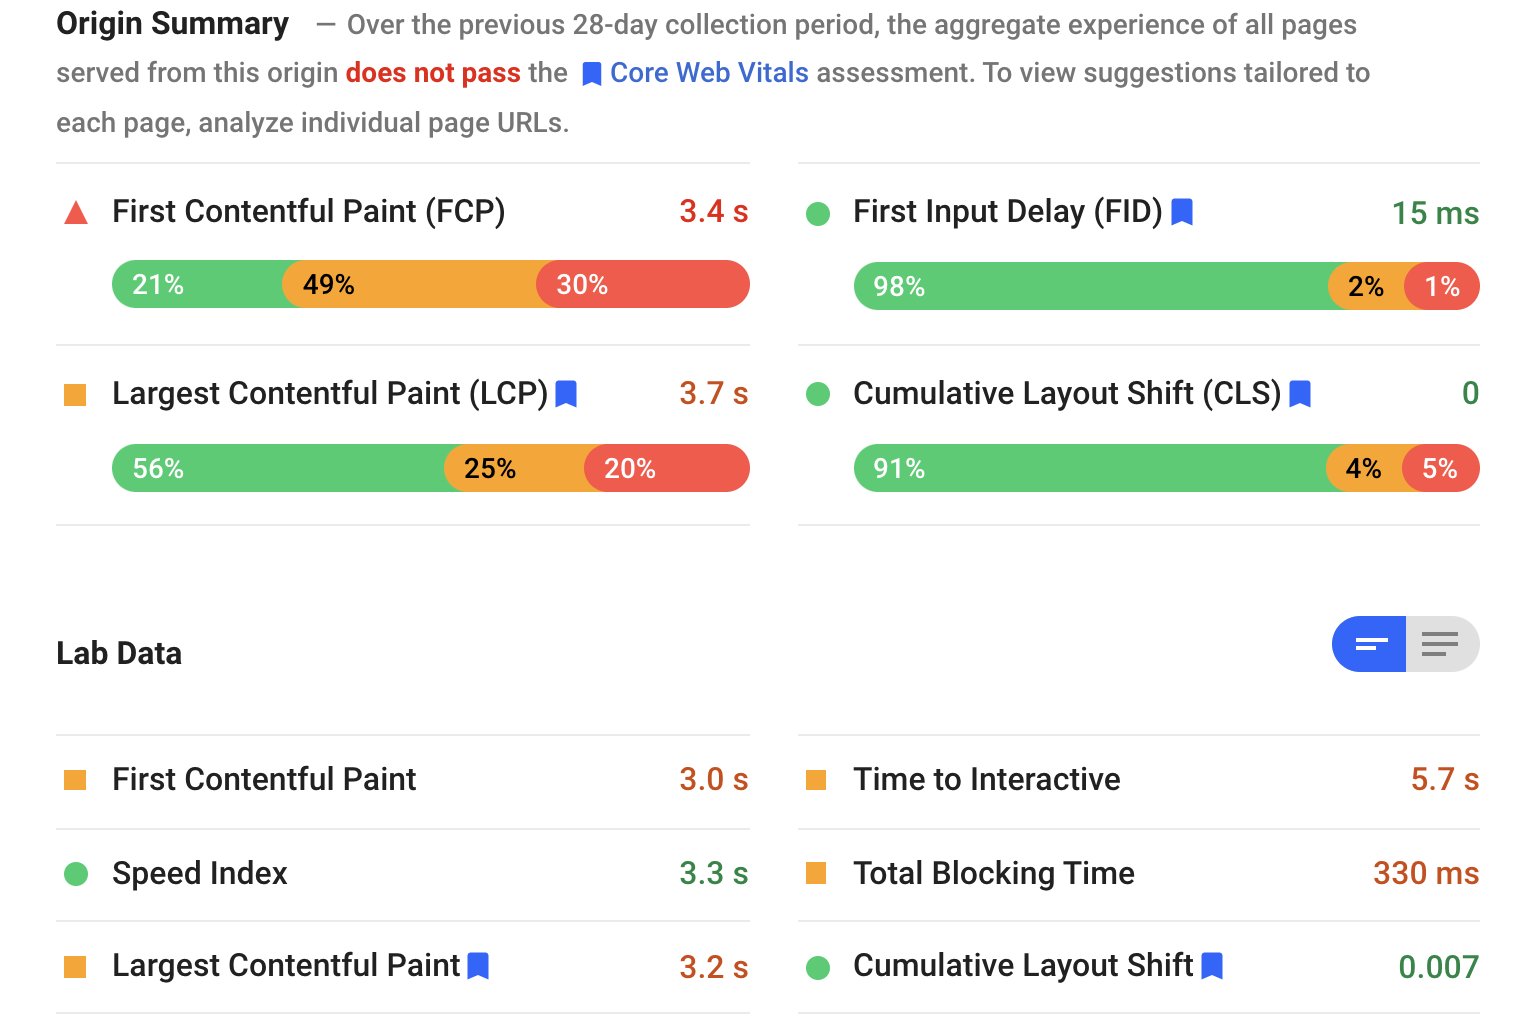
You've spent hours optimizing your site's Largest Contentful Paint (LCP), fixing Cumulative Layout Shift (CLS) issues, and improving Interaction to Next Paint (INP). Your lab scores in PageSpeed Insights look great, but your field data hasn't budged.

This is normal. Google operates on a 28-day rolling window for Core Web Vitals field data.

Why the 28-Day Delay Exists

Core Web Vitals Field Data Updates Take 28 Days - Here's What to Track

Field data comes from real users visiting your site through Chrome's User Experience Report (CrUX). Google needs enough real-world data to make statistical assessments about your site's performance.

The 28-day window ensures:

  • Sufficient sample size from actual users
  • Reduced impact of temporary spikes or dips
  • More reliable performance measurements

What to Monitor During the Waiting Period

Track Lab Data First

Use PageSpeed Insights and Lighthouse to verify your fixes work in controlled conditions. If lab scores improve but field data doesn't after 28 days, you might have implementation issues.

Monitor Real User Monitoring (RUM)

Set up your own performance tracking with tools like:

  • Web Vitals JavaScript library
  • Google Analytics 4 Core Web Vitals reporting
  • Third-party RUM tools

This gives you faster feedback than waiting for CrUX updates.

Use Search Console's Validation Feature

Google Search Console lets you validate Core Web Vitals fixes. Click "Validate Fix" after making improvements. Google will still take about 28 days to confirm, but you'll get official notification when the fix is recognized.

Setting Realistic Expectations

Tell clients and stakeholders about the 28-day cycle upfront. Nothing kills confidence in SEO work like "broken" fixes that actually need time to register.

Document your improvements with screenshots of lab scores and your own performance monitoring. This shows progress even when official metrics haven't updated yet.

Remember: if your lab scores improved significantly but field data stays poor after 30+ days, investigate whether your fixes apply to all user scenarios and devices.

Want the full playbook? Read our guide on Technical SEO Audits: Which Fixes to Prioritize First.

Key Takeaway

Core Web Vitals field data runs on a 28-day rolling window, so use lab scores and real-user monitoring to confirm fixes before official metrics catch up.

Source: @azarchick on Twitter/X

Full tip page
Beginner Quick Win

The Problem

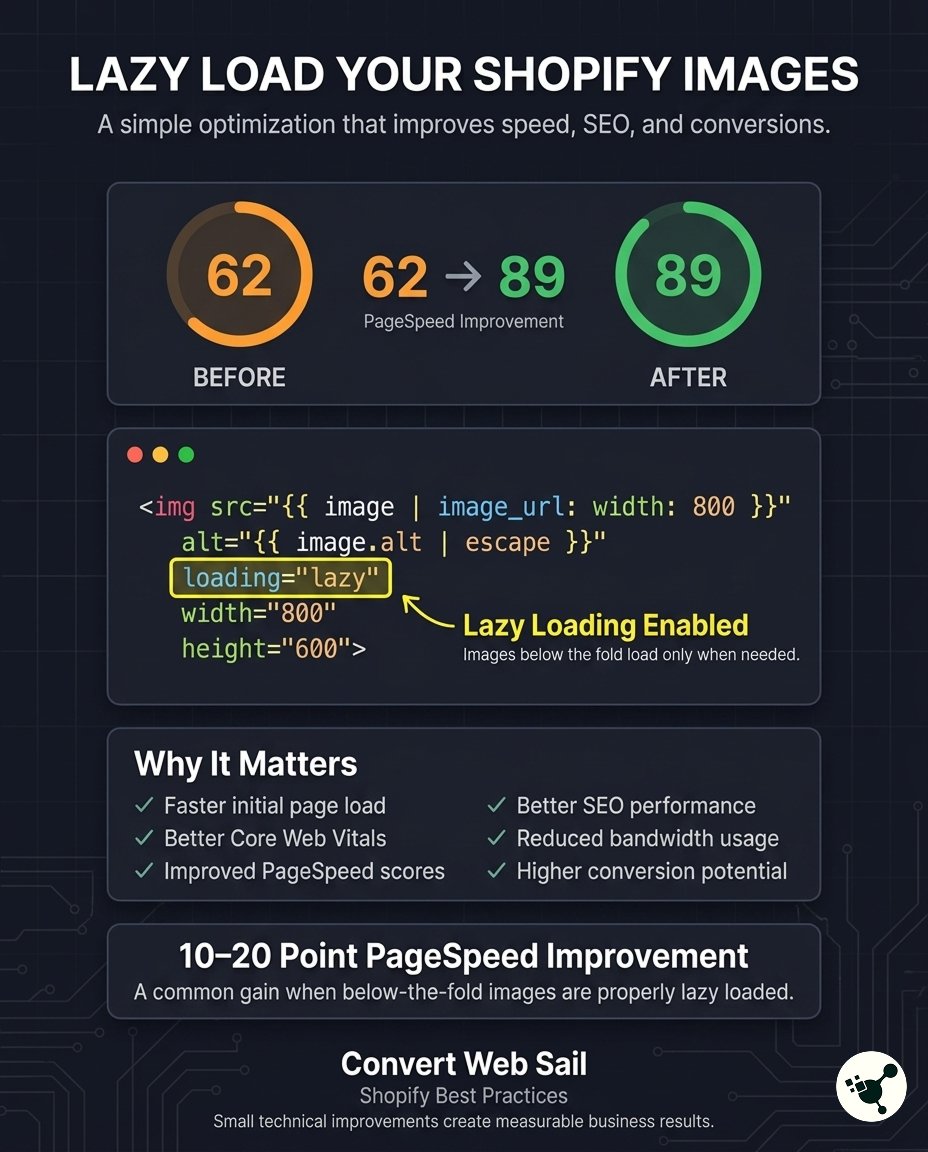
Most Shopify stores load every image immediately when a page loads, even images users can't see. This kills your PageSpeed scores and hurts conversions.

The fix? Add one simple attribute to your image tags.

The Solution: Lazy Loading

Boost Shopify PageSpeed 10-20 Points with One Simple Image Fix

Add loading="lazy" to every image that isn't in your hero section:

<img
 src="{{ image | image_url: width: 800 }}"
 alt="{{ image.alt | escape }}"
 loading="lazy"
 width="800"
 height="600"
>

Why This Works

Lazy loading tells browsers to only load images when users scroll near them. Instead of downloading 20 product images at once, the browser loads just the visible ones.

This dramatically reduces:

According to Google, implementing lazy loading can reduce initial page load times by up to 50% for image-heavy pages.

  • Initial page load time
  • Bandwidth usage
  • Time to interactive

Where to Apply This

Add lazy loading to:

  • Product grid images
  • Gallery images
  • Footer images
  • Testimonial photos
  • Any image below the fold

Don't add it to:

  • Hero images
  • Logo
  • Critical above-the-fold content

Implementation Steps

  1. Open your Shopify theme editor
  2. Find your product template files (usually in sections/ or templates/)
  3. Locate image tags
  4. Add loading="lazy" to each img tag below the hero
  5. Test with PageSpeed Insights

Expected Results

This single change typically improves PageSpeed scores by 10-20 points. Better scores mean:

  • Higher search rankings
  • Faster user experience
  • Better conversion rates
  • Lower bounce rates

The best part? This takes 10 minutes to implement and works immediately.

Want the full playbook? Read our guide on Ecommerce SEO Quick Wins: Rank Higher in Days.

Key Takeaway

Add loading="lazy" to every below-the-fold Shopify image so browsers load only visible ones, cutting initial load time and lifting PageSpeed scores.

Source: @h4harisali on Twitter/X

Full tip page

Putting these core web vitals tips into action

The 8 tips above represent the most validated core web vitals advice in the PocketSEO database — each one sourced from a practitioner who shared their finding publicly with their name attached. But reading tips is not the same as implementing them.

Start with the beginner-level quick wins — these are changes you can ship in under an hour that deliver measurable results within weeks. Once your foundation is solid, work through the intermediate and advanced tips systematically. Every tip links to its original source so you can verify the context and adapt the advice to your specific situation.

For more core web vitals resources, explore our guides, checklists, and the full tip directory below.

Best Tips by Category

Get the weekly SEO digest

Get 3 actionable SEO tips every week — free.

Join solo founders leveling up their SEO. Unsubscribe anytime.